
Market Data - August 2026
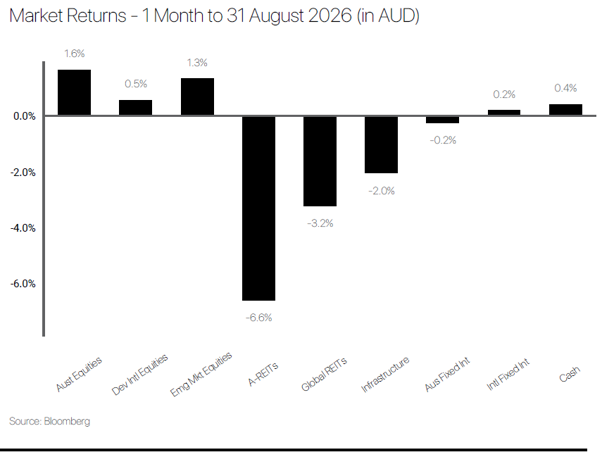
Market Returns - 1 Month to 31 July 2026 (in AUD)
Market Commentary
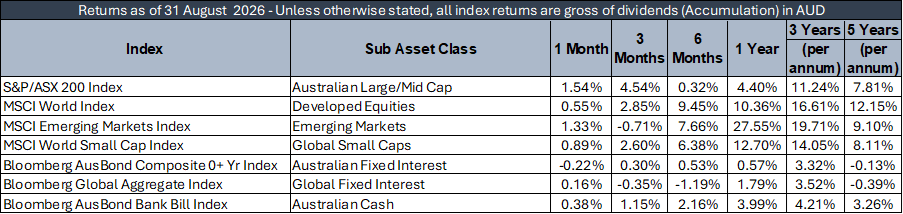
August2026 was a month that shifted on a single speech. U.S. markets had spent mostof the month pricing out further rate hikes on soft economic data, only for FedChair Kevin Warsh to use his Jackson Hole address to make clear that inflationremained too high, repricing the December policy rate by roughly half a hike ina single session.
Internationalmarkets were defined by an increasingly discriminating AI narrative. Microsoft,Amazon, Alphabet, and Meta announced combined 2026 capital expenditureprojections of approximately $725 billion, yet investors began demandingclearer evidence of monetisation, triggering corrections in select technologynames. Semiconductor-heavy emerging markets, particularly South Korea, moved innear-lockstep with the Nasdaq as the chip complex whipsawed sharply across themonth.
Domestically,the picture was mixed. June-quarter trimmed mean inflation came in softer thanexpected, pulling the annual rate below RBA forecasts, but July CPI datasubsequently disappointed, with headline inflation easing only to 3.5% and thetrimmed mean holding at 3.6%.
TheRBA held the cash rate at 4.35%, with August meeting minutes confined strictlyto holding or hiking. Reporting season proved a genuine catalyst for rotation,with healthcare, industrials, and materials rallying while the major banksfaced headwinds from reversing passive flows.
Incommodities, by month-end Brent crude neared $100 US/ barrel amid ongoinggeopolitical tensions through the Strait of Hormuz, while gold gainedapproximately 10%. At the long end, the 30-year U.S. Treasury yield reached itshighest level since 2007 and Australian ten-year yields climbed above 5%, withstocks and bonds moving in the same direction.
Lookingahead, investors will be watching whether central banks can maintain theirresolve on long-dated yields, and whether corporate earnings can sustaincurrent valuations as the prospect of further rate hikes moves from tail riskto base case.
Defensive Income
The Prime Defensive portfolio produced a +0.29% return (before platform administration fees) over the month relative to a +0.34% target return. The portfolio has delivered a +4.00% return over the past 12 months, +0.05% above the target return.
TheUS yield curve bear flattened in August as the short end sold off slightly morethan the back end. The 2y yield rose 5bps to 4.34%, while the 10y yield wasbroadly flat, rising 1bp to 4.75%. Yields initially moved lower during themonth following softer US inflation data and weaker labour market indicators.However, that move was quickly reversed as concerns around the inflation andfiscal outlook persisted. The sell-off intensified towards month-end followingFed Chair Warsh’s hawkish comments, which prompted markets to increaseexpectations for a September rate hike. Credit markets were more stable, with5y CDX IG narrowing 1bp to +50bps and CDX HY narrowing 12bps to +300bps.
Domesticyields moved higher across the curve, with the 2y yield closing 17bps higher at4.69%, and the 10y yield 16bps higher at 5.09%. The key data release was themonthly CPI indicator for July, which came in above consensus on headlineinflation (3.5% vs 3.3% expected), while trimmed mean inflation held at 3.6%for a second straight month, remaining above forecasts. Yields continued torise through the second half of the month, with escalating Middle East tensionsand firmer oil prices adding a further layer of upward pressure. Domesticcredit markets softened, with our BA A$ Tier 2 FRN 5y Index widening 5bps to+133bps and our BA A$ IG Corporate Hybrids Index widening 8bps to +178bps.
Portfolio performance was resilient over the month, despite higher global yields weighing on overall capital performance. Our duration holdings via Pendal and PIMCO consequently detracted from returns, while private credit holdings were the strongest performers. However, this outperformance needs to be considered in the context of private credit assets not being marked-to-market. We are seeing some cracks emerging in the broader private credit market, particularly in real estate private debt, and will look to reduce our exposure over the coming months despite maintaining confidence in the individual managers.
Australian Equities
The Australian equities portfolio returned 3.22% in August 2026, outperforming the ASX 200’s 1.54% gain. Gold and copper prices surged in a volatile month as the Reserve Chairman Kevin Warsh’s pledge to fight inflation did not give rest to worries regarding inflation amidst record capital expenditures to develop artificial intelligence.
Againstthis backdrop, gold producers Evolution Mining (32.0%) and Newmont (+31.1%)rallied strongly with their FY26 results showing strong double digit cashearnings growth due to higher realised sales prices and costs remainingrelatively well controlled.
Medicalcompanies CSL (+39.4%), Cochlear (+11.7%) and Resmed (+11.2%) were also majorcontributors to outperformance as their FY26 results were better than fearedfollowing downgrades earlier in the year. It seems the industry more broadly may have stabilised following a toughfew years with all three companies remaining generally positive on the outlookfor FY27 earnings growth.
Outsideof gold and healthcare we saw some idiosyncratic outperformance across ourportfolio in response to strong FY26 earnings updates. Lithium producer PLS(+30.1%) climbed as it posted bumper profits as demand from the energy storagesector have continued to boost prices. Another hot commodity, Copper, sawSandfire (+21.0%) report a 41% increase in sales revenue and a surprise, fullyfranked dividend. Other strong performers included Codan (+17.2%), UniversalStore Holdings (+12.6%) and REA Group (+11.8%) as their FY26 earnings and FY27guidance updates beat consensus expectations.
JBHHi-Fi (-16.1%) and Wesfarmers (-11.1%) detracted after weaker-than-expectedFY26 results with analysts revising earnings downwards for FY27. The consumersector remains broadly soft as the housing market continues to weaken. SKSTechnologies (-11.7%) also dragged lower as investors took profits from ayearslong AI data centre trade.
International Equities
The Prime International Growth Portfolio returned +4.3% in May 2026, as global equity markets pushed to record highs on the back of a robust earnings season, a pullback in oil prices as Middle East ceasefire talks progressed, and sustained investor appetite for artificial intelligence and semiconductor-related names.
The iShares MSCI Japan ETF (+7.4%) and iShares S&P 500 AUD Hedged ETF (+6.5%) were the strongest contributors over the month, reflecting broad gains across both markets. The Munro Concentrated Global Growth Fund (+7.2%) and Munro Global Growth Small & Mid Cap Fund (+5.4%) also performed well, with both strategies benefiting from an environment that firmly favoured growth over value. The other side of the ledger was led by Trinetra Emerging Market Growth (-3.0%), which faced a more difficult backdrop, while Langdon Global Smaller Companies (+0.5%) and the Maquarie IFP Global Franchise Fund (+0.2%) failed to keep pace with the broader rally.
Over the twelve months to end of May, the portfolio returned +14.4%, a result that reflects both the strength of its core growth holdings and the drag from a handful of more challenging positions. The iShares S&P 500 AUD Hedged ETF (+28.1%), Munro Global Growth Small & Mid Cap (+27.6%), Plato Global Alpha (+24.8%), and Munro Concentrated Global Growth (+21.5%) were all meaningful contributors over the period. Against this, Langdon Global Smaller Companies (-17.9%) was the standout detractor, weighed down by the persistent headwinds facing quality smaller companies in a concentrated market leader environment, while the Maquarie IFP Global Franchise Fund (-7.54%) and Trinetra Emerging Market Growth (-11.2%) also held back returns as quality-oriented and emerging market strategies struggled against the AI-driven momentum trade that dominated much of the year.
Balanced Multi-asset
The Prime Balanced Portfolio returned 0.7% in August 2026, a month in which reporting season drove a rotation in Australian shares, with healthcare, industrials and materials rallying while the major banks faced reversing passive flows. The Betashares Australian Ex-20 Portfolio Diversifier ETF(+5.8%) and Spheria Australian Smaller Companies Fund (+3.8%) captured the rotation; the iShares S&P/ASX 20 ETF (-0.6%) fell with the banks.
Long-datedyields moved against rate sensitive assets, with the 30-year US Treasury yieldat its highest since 2007 and Australian ten-year yields above 5% after Julyinflation disappointed and the RBA kept a hike on the table. The ResolutionCapital Global Property Securities Fund (-3.4%), ClearBridge RAREInfrastructure Income Fund (-3.5%) and Vanguard Global Infrastructure ETF(-3.5%) declined, while Global X Physical Gold (+6.5%) rose with Strait ofHormuz tensions.
Overthe year to August the portfolio returned 5.7%. Three RBA rate rises andinflation above 3.5% held Australian bond returns near 1.5%, so the preferencefor floating rate credit including the Metrics Direct Income Fund (+8.5%) andMA Priority Income Fund (+8.2%) over the Pendal Government Bond Fund (+0.2%)added most value, alongside Global X Physical Gold (+18.1%) and ResolutionCapital (+14.2%).
Australianequities were the main drag: the Betashares Ex-20 ETF (-0.2%), Ophir HighConviction Fund (-11.2%) and Spheria (-7.6%) missed the resources-led gainscaptured by the iShares S&P/ASX 20 ETF (+8.3%), while the Langdon GlobalSmaller Companies Fund (-11.3%) and Trinetra Emerging Markets Growth Trust(-15.7%) detracted.
The information in this article contains general advice and is provided by Primestock Securities Ltd AFSL 239180. That advice has been prepared without taking your personal objectives, financial situation or needs into account. Before acting on this general advice, you should consider the appropriateness of it having regard to your personal objectives, financial situation and needs. You should obtain and read the Product Disclosure Statement (PDS) before making any decision to acquire any financial product referred to in this article. Please refer to the FSG (www.primefinancial.com.au/fsg) for contact information and information about remuneration and associations with product issuers. This information should not be relied upon as a substitute for professional advice, and we encourage you to seek specific advice from your professional adviser before making a decision on the matters discussed in this article. Information in this article is current at the date of this article, and we have no obligation to update or revise it as a result of any change in events, circumstances or conditions upon which it is based.