
Market Data - March 2026
Market Returns - 1 Month to 31 March 2026 (in AUD)
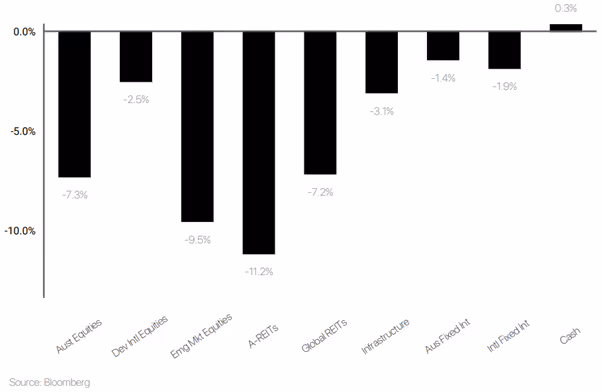
Market Commentary
March 2026 was dominated by a sharp escalation in Middle East hostilities involving the U.S., Israel and Iran, with the Strait of Hormuz effectively closed for much of the month. The disruption triggered a major oil-supply shock, with Brent crude rising into the low $110s USD per barrel and recording one of its largest weekly gains in decades, alongside a record monthly surge.
International equity markets buckled under the weight of surging energy costs and rising yields. In the United States, the S&P 500 fell below its 200-day moving average, while the Federal Reserve’s policy outlook shifted more hawkishly. European and UK markets faced similar headwinds, with 10-year gilt yields reaching their highest levels since 2008. Brief rallies sparked by ceasefire diplomacy were quickly extinguished as negotiations stalled. The technology sector faced compounding pressures from rising power costs for AI infrastructure and supply chain disruptions.
Domestically, the ASX 200 retreated over the month despite the country’s status as a net energy exporter. The Reserve Bank of Australia raised the cash rate to 4.10%, with Governor Michele Bullock highlighting the risk that sustained energy-driven inflation could complicate the outlook and weigh on growth. A clear domestic divergence emerged, with energy producers and gold miners outperforming, while retail and other consumer-exposed sectors faced headwinds from weakening confidence.
Commodities were led by oil’s sharp rally, while gold eased from its highs amid shifting rate expectations and bouts of liquidity-driven selling. Bond yields rose across major economies as markets adjusted to the inflationary implications of the energy shock.
Looking ahead, the duration of the Hormuz closure and any broadening of the conflict remain the critical variables to watch. The concern is no longer simply inflation but whether prolonged energy disruption begins to weigh on global growth.
Defensive Income
The Prime Defensive portfolio produced a -0.45% return (before platform administration fees) over the month relative to a +0.32% target return. The portfolio has delivered a +4.38% return over the past 12 months, +0.59% above the target return.
March was a soft month for fixed income, with yields moving higher and credit spreads widening. Escalating geopolitical tensions in the Middle East culminated in late February with a material intensification of the conflict, resulting in the closure of the Strait of Hormuz and a subsequent supply shock to global oil markets. This drove a sharp increase in oil prices and a rise in broader market volatility. Higher energy prices have fed directly into inflation expectations, providing the initial impetus for the selloff in rates. Over the month, ACGB 2y and 10y yields closed +47bps and +32bps higher at 4.66% and 4.97%, alongside a similar move in USTs with the 2y +42bps higher at 3.80% and 10y +38bps higher at 4.32%.
Beyond the immediate inflationary impulse, the disruption to energy supply has broader implications for global supply chains, increasing the risk of more persistent cost pressures. This has begun to be reflected in credit markets, with spreads moving wider. While the widening in spreads has remained relatively modest compared to the move in rates, a prolonged disruption to the Strait and sustained elevation in oil prices would likely lead to further repricing of credit risk and more pronounced spread widening. For the month US 5y IG CDX spread widened +7bps to +63bps and HY +53bps higher to +385bps. Domestically, our A$ IG Corporate Hybrid 5-year FRN index widened 25bps to +180bps and the A$ Big Four Senior Unsecured index widened 2bps to +73bps.
Portfolio performance was soft over the month, despite strong contributions from MDIF (+0.71%) and MA PIF (+0.68%). Duration exposure was the primary detractor, with offshore and domestic allocations – via Pimco Global Bond Fund and Pendal Government Bond Fund – returning -2.02% and -1.68%, respectively.
Australian Equities
The Australian equities portfolio returned -6.84% in March 2026, slightly outperforming the ASX200 market return of -7.15%, with returns increasingly driven by sector and commodity exposure. Market conditions remained volatile as geopolitical tensions, particularly ongoing conflict in the Middle East, pushed energy prices higher and reinforced dispersion across the Australian market. While elevated inflation uncertainty and cautious interest rate expectations continued to weigh on financials and growth names, commodity-linked exposures provided meaningful support to portfolio outcomes.
Energy and oil‑linked holdings were the standout contributors during the month, benefitting from sustained strength in crude oil prices amid supply disruption risks. Santos (+15.56%) and Woodside Energy (+11.50%) were the strongest performers in the portfolio, reflecting higher realised pricing and improved near-term cash flow expectations. Resource exposures also showed pockets of resilience despite broader equity weakness, with APA Group (+8.15%), Coles (+7.64%) and Suncorp (+6.29%) providing additional defensiveness and income stability during a period of heightened uncertainty.
Offsetting these gains, portfolio performance was dragged by weakness across banks, healthcare and selected growth stocks, as higher-for-longer rate expectations and risk-off sentiment pressured valuations. National Australia Bank (‑15.46%), Evolution Mining (‑19.97%), Netwealth (‑15.13%) and Goodman Group (‑11.75%) were among the weakest performers. Healthcare and growth names such as Pro Medicus (‑10.46%), Cochlear (‑9.86%) and CSL (‑2.41%) also detracted, continuing the trend of valuation compression seen earlier in the year. Overall, March highlighted the portfolio’s sensitivity to macro drivers, with energy exposure acting as a key stabiliser against broader market and sector‑specific weakness.
International Equities
The Prime International Growth Portfolio returned -6.2% in March 2026, reflecting the broad global equity sell-off triggered by the escalation in Middle East hostilities and the effective closure of the Strait of Hormuz. Surging oil prices and rising bond yields hit equity markets hard across all major regions, and the portfolio's concentrated exposure to global equities amplified the impact.
The iShares S&P 500 Hedged ETF (-7.5%) was the single largest detractor given its significant weight in the portfolio, while the iShares MSCI Japan (-8.6%), Langdon Global Smaller Companies (-8.9%), and iShares Europe ETF (-7.0%) also fell sharply. The Munro funds and Plato Global Alpha (-2.6%) provided the most meaningful insulation, with Munro Concentrated Global Growth (-2.7%) and Munro Global Growth Small & Mid Cap (-2.9%) both holding up considerably better than the broader market.
Over the twelve months to the end of March, the portfolio returned +10.2%, a pleasing result in what was a volatile environment. The Munro Concentrated Global Growth Fund (+17.0%) was the standout contributor, rewarding its high-conviction approach to structural growth themes. The iShares S&P 500 Hedged ETF (+15.4%), iShares MSCI Japan (+15.1%), and Plato Global Alpha (+22.3%) also added meaningfully over the year. Partially offsetting these gains, Langdon Global Smaller Companies (-13.9%) was the most significant detractor, as smaller companies faced persistent headwinds from elevated interest rates and cautious investor sentiment. The IFP Global Franchise Fund (-11.2%) and Aoris International Fund (-9.1%) also weighed on returns, struggling in an environment that favoured larger-cap and momentum-driven names over quality and value-oriented strategies.
Balanced Multi-asset
The Prime Balanced Portfolio returned -4.3% in March 2026, reflecting the broad market fallout from the escalation in Middle East hostilities and the effective closure of the Strait of Hormuz. Rising energy costs and surging bond yields weighed heavily on growth-oriented assets, and the portfolio was not immune.
Global equities were the most significant drag, with the iShares S&P 500 Hedged ETF (-7.5%), iShares MSCI Japan (-8.6%), Langdon Global Smaller Companies (-8.9%), and Vanguard FTSE All-World Ex-US (-7.7%) all declining sharply. The Munro funds provided some insulation, with Munro Concentrated Global Growth (-2.7%) and Munro Global Growth Small & Mid Cap (-2.9%) holding up considerably better than peers. Within Australian equities, BetaShares AU Ex-20 (-9.8%) and Spheria Australian Small Companies (-9.2%) detracted as the RBA's decision to raise the cash rate to 4.10% compounded domestic headwinds. The alternatives and fixed income allocations provided meaningful ballast, with Vanguard Global Infrastructure (+1.5%), MA Priority Income (+0.7%), and Metrics Direct Income (+0.6%) all generating positive returns amid the turbulence.
Over the twelve months to the end of March, the portfolio delivered +8.9%, with the alternatives allocation the standout contributor, anchored by Global X Physical Gold (+34.1%) as geopolitical uncertainty and central bank demand drove prices higher. The ClearBridge Infrastructure Fund (+16.4%) and higher-yielding credit strategies — including MA Priority Income (+8.0%) and Realm High Income (+4.8%) — added further value. Global equities contributed through the iShares S&P 500 Hedged ETF (+15.4%) and Munro Concentrated Global Growth (+17.1%), while the Ophir High Conviction Fund (+1.4%) and Langdon Global Smaller Companies (-13.9%) were the key detractors over the year.
The information in this article contains general advice and is provided by Primestock Securities Ltd AFSL 239180. That advice has been prepared without taking your personal objectives, financial situation or needs into account. Before acting on this general advice, you should consider the appropriateness of it having regard to your personal objectives, financial situation and needs. You should obtain and read the Product Disclosure Statement (PDS) before making any decision to acquire any financial product referred to in this article. Please refer to the FSG (www.primefinancial.com.au/fsg) for contact information and information about remuneration and associations with product issuers. This information should not be relied upon as a substitute for professional advice, and we encourage you to seek specific advice from your professional adviser before making a decision on the matters discussed in this article. Information in this article is current at the date of this article, and we have no obligation to update or revise it as a result of any change in events, circumstances or conditions upon which it is based.