
Market Data - January 2026

Market Returns - 1 Month to 31 January 2026 (in AUD)
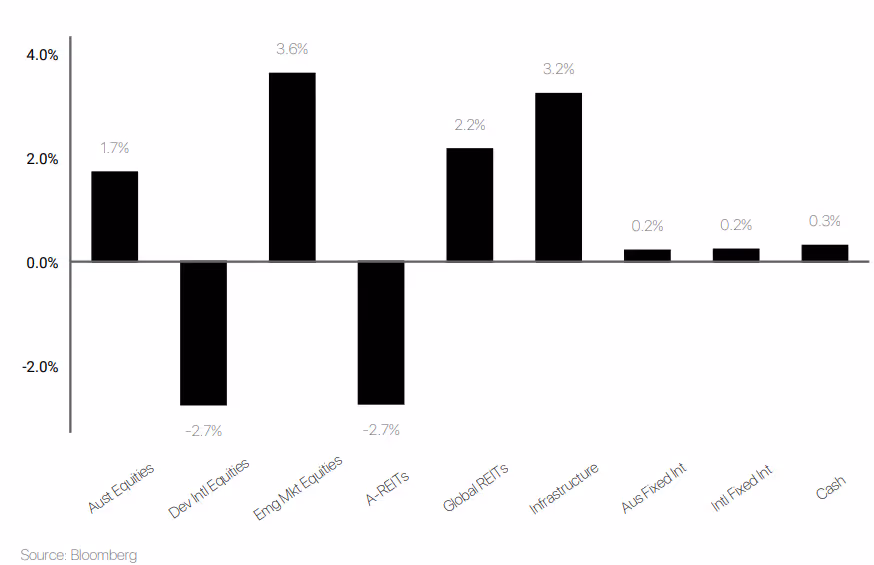
Market Commentary
January 2026 delivered a volatile start to the year asmarkets grappled with renewed geopolitical friction, shifting sectorleadership, and diverging regional economic trajectories. The absence of atraditional “Santa rally” over the holiday period gave way to a pronounced"risk-off" sentiment, with major U.S. indices retreating mid-month.This drove a flight to safety that pushed gold and silver to record highs.Beneath the headline volatility however, a market rotation emerged as mega-captechnology stocks faced selling pressure, whilst market breadth improved asglobal small caps and emerging markets led the charge.
In the U.S., the labour market remained tight with joblessclaims hitting two-year lows. European data offered modest signs of recovery,with Germany confirming its first positive annual growth in two years, whileChina met its growth targets through export strength despite persistentdomestic weakness. Currency markets reflected these shifts, as the U.S. dollarsoftened to four-month lows amid speculation of currency interventions andconcerns over sovereign debt levels.
Australia diverged from global easing trends, with inflationproving persistent. Headline CPI rose to 3.8%, driven by housing costs and theunwinding of energy rebates, while unemployment fell to 4.1%. This shiftedexpectations toward an imminent rate hike, pushing Australian 10-year yieldstoward 4.9% and creating a notable policy dislocation versus other majoreconomies. This has reinforced a "stock-picker’s" market locally, asinvestors balance the strength of major banks against volatility in the resourcessector.
Looking ahead, markets remain highly sensitive tofiscal-monetary interactions. After three years of double-digit equity returns,valuations appear stretched, raising adjustment risks. Investors are closelymonitoring whether U.S. technology earnings can justify lofty growthexpectations and how U.S. credit spreads will react to evolving recessionprobabilities. Portfolio resilience and diversification remain critical amid elevated geopolitical and valuation risks.
Defensive Income
The Prime Defensive portfolio produced a +0.50% return overthe month relative to a +0.30% target return. The portfolio has delivered a+5.45% return over the past 12 months, +1.56% above the target return.
To start 2026 credit spreads continued to grind tighter, andyield curves shifted higher. Rising Japanese yields threaten the economics ofthe yen funded carry trade, while the US administration is supporting a weakerUS dollar. Taken together, these dynamics place upward pressure on UST yields.The 2y and 10y US Treasury yields closed the month 4bps and 7bps higher at3.52% and 4.24% respectively. US credit remained resilient, with IG CDX 5-yeartightening 1bp to +49bp and HY CDX compressing a more notable -21bps touncomfortably low levels of +296bps.
In Australia, the yield curve bear flattened as hotter thanexpected inflation prints heightened expectations of imminent policytightening. The domestic economy remains relatively firm, supported by a tightlabour market and satisfactory growth. Now, following two consecutive upsideinflation surprises in the most recent quarters, markets were confident(>70%) that the RBA will tighten policy at the February meeting – which itdid last week (+25bps to 3.85%). As a result, domestic duration underperformedfor a third consecutive month, with the ACGB 10y yield rising +7bps to 4.81%and the 2y increasing +15bps to 4.21%. However, the credit momentum continueswith our A$ Tier 2 FRN 5y tightening 17bps and closing the month at a newhistoric tight of +113bps.
Portfolio performance was largely positive over the month,with notable contributions from Yarra Higher Income Fund (+0.70%) and MDIF(+0.69%). Importantly, despite upward pressure on yields, our durationpositioning still contributed positively to overall returns.
We introduced the Barings Liquidity Investment Strategy for~4% of the portfolio. This increases our exposure to high-quality domestic RMBS, which we expect to deliver a resilient income stream well suited to the current stage of the cycle.
Australian Equities
TheAustralian Growth portfolio returned 2.53% in January 2026, outperforming the1.78% rise in the S&P/ASX 200 Accumulation Index. Market strength continuedto be led by commodities, with gold, copper and energy prices remaining firmamid geopolitical uncertainty and early signs of a global industrial recovery. Financialsalso contributed modestly as expectations for the first RBA rate cut shiftedinto the second half of 2026, while healthcare and consumer names traded mixedand technology underperformed as investors rotated back toward cyclicals.
Performancefor the portfolio was driven predominantly by resources, with standout gainsfrom Codan (+33.80%), Evolution (+16.01%), Newmont (+15.37%), Santos (+13.61%)and BHP (+11.17%), supported by stronger commodity pricing and company‑specificcatalysts. Large‑cap quality names such as Macquarie (+4.42%), CSL (+5.08%),Cochlear (+3.24%), REA (+3.47%), Rio Tinto (+3.22%), NAB (+2.51%), andWesfarmers (+2.80%) also added to returns. These gains more than offsetweakness across higher‑valuation technology and selective consumer stocks,where Pro Medicus (‑16.64%), Block (‑10.42%), Technology One (‑9.91%),Aristocrat (‑7.94%), and Super Retail Group (‑8.30%) detracted. Despite thesesoftness pockets, the portfolio’s overweight exposure to commodities anddisciplined balance across financials and defensive growth supported ameaningful outperformance for the month.
International Equities
The portfolio declined by -0.74% in January versus -2.66%for the benchmark, holding up better than broader global equity markets amid avolatile start to 2026. Weakness was concentrated in higher-growth globalequities as bond yields firmed and investors rotated toward more defensive anddomestic exposures. Growth-oriented managers were most affected, with LangdonGlobal Smaller Companies (-6.3%) and Aoris International (-8.0%) detracting assmaller-cap and select quality names corrected sharply. Munro ConcentratedGlobal Growth (-3.8%) and IFP Global Franchise (-3.9%) also softened amid thestyle rotation. Offsetting this weakness, the iShares S&P 500 AUD HedgedETF (+0.8%) and iShares MSCI Japan (+2.1%) provided resilience, supported bysolid US earnings momentum and ongoing Japanese corporate reform.
January illustrated the portfolio’s balanced construction.While its allocation to structural growth themes created short-term headwinds,in line with the market, diversified regional exposures limited downside.Japanese equities continued to benefit from improving governance standards andshareholder returns. Emerging markets remained uneven, though Trinetra EmergingMarkets Growth has delivered a solid (+11.6%) over the year despiteintermittent Chinese macro weakness.
Over the twelve months to January, the portfolio hasadvanced 8.5%, reflecting broad participation across developed markets during ayear marked by AI-driven earnings upgrades, improving global industrialactivity and shifting central bank expectations. The iShares S&P 500 AUDHedged ETF was a major contributor, capturing strong US profit growth withoutcurrency drag. European equities (+17.2%) and Japanese equities (+15.9%) addedmeaningfully as market leadership broadened. Plato Global Alpha (+24.7%) and Munro Concentrated Global Growth (+6.7%) supported returns, partially offset by Aoris International (-9.3%) and Langdon Global Smaller Companies (-3.6%), which faced periodic style headwinds.
Balanced Multi-asset
The portfolio advanced 1.19% in January compared to itsbenchmark of 0.36%, navigating a mixed market backdrop where equity leadershiprotated and particular defensive assets regained favour. Strength in realassets and Australian equities offset softer global growth exposures. Global XPhysical Gold (+10.0%) was a standout contributor as investors sought inflationprotection and geopolitical hedges, while Betashares Australian Ex-20 PortfolioDiversifiers (+2.2%) and the iShares S&P/ASX 20 ETF (+2.0%) benefited fromresilient domestic large caps. Global property via Resolution Capital (+3.2%)also added value as bond yields stabilised late in the month. These gains morethan offset weakness in growth-oriented managers, including Langdon GlobalSmaller Companies (-6.3%) and Munro Concentrated Global Growth (-3.8%), whichwere impacted by renewed volatility in global technology shares.
In January, real assets, income-oriented equities and goldprovided protection against style rotation in global growth stocks. Credit andalternatives were mixed, with Smart Money Long-Short Credit (-1.3%) modestlydetracting, while diversified equity exposures helped smooth overall returnsdespite ongoing uncertainty around central bank policy and earningsexpectations.
Over the year to January, the portfolio has risen 10.32%,reflecting a year characterised by strong US earnings, resilient domesticconditions and elevated geopolitical uncertainty. The iShares S&P 500 AUDHedged ETF was a major driver, capturing robust US profit growth withoutcurrency drag. Gold (+57.1%) materially enhanced returns amid persistentinflation concerns. Australian diversified equity exposure's and global ex-USequities contributed as market leadership broadened beyond mega-cap technology.Infrastructure via CBI Rare Infrastructure (+16.0%) also added steadily.Offsetting these gains were softer outcomes from Langdon Global SmallerCompanies (-3.6%) and select alternative strategies, though overalldiversification across growth, income and real assets supported solid annualprogress.
The information in this article contains general advice and is provided by Primestock Securities Ltd AFSL 239180. That advice has been prepared without taking your personal objectives, financial situation or needs into account. Before acting on this general advice, you should consider the appropriateness of it having regard to your personal objectives, financial situation and needs. You should obtain and read the Product Disclosure Statement (PDS) before making any decision to acquire any financial product referred to in this article. Please refer to the FSG (www.primefinancial.com.au/fsg) for contact information and information about remuneration and associations with product issuers. This information should not be relied upon as a substitute for professional advice, and we encourage you to seek specific advice from your professional adviser before making a decision on the matters discussed in this article. Information in this article is current at the date of this article, and we have no obligation to update or revise it as a result of any change in events, circumstances or conditions upon which it is based.